Radial Landscape Maps– A Revolution in Brand Mapping and…
Market researchers and data analysts have for many years used various visual representations of their data. Their objective has always been to ‘visualise the insight’ using a chart rather than to show rows and columns of tables.
One such chart that has been used over the years is the ‘brand perception map’. The map is created via a multivariate statistical data reduction method known as ‘Correspondence Analysis’, which attempts to describe the relationship between a large battery of brand attributes and a number of brands*. This has proven very useful within the market research community as often there has been a requirement to analyse competing brands against a set of descriptors that relate to, for example, individual personalities and perceptions held by customers. In this way, correspondence analysis is an excellent technique used to tease out insights from survey data that would otherwise take hours, running and examining cross-tabulations.
Correspondence maps should help to answer the following questions:
ü How is my brand viewed by the market?
ü What are the perceptual attributes that distinguish the brands?
ü Who are my close competitors viewed by the market?
ü Which competitors do not really compete with my brand at all?
ü What do the brand image attributes mean for communications strategy?
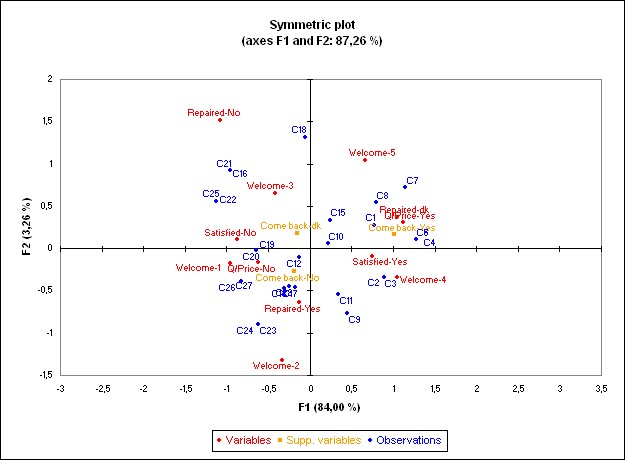
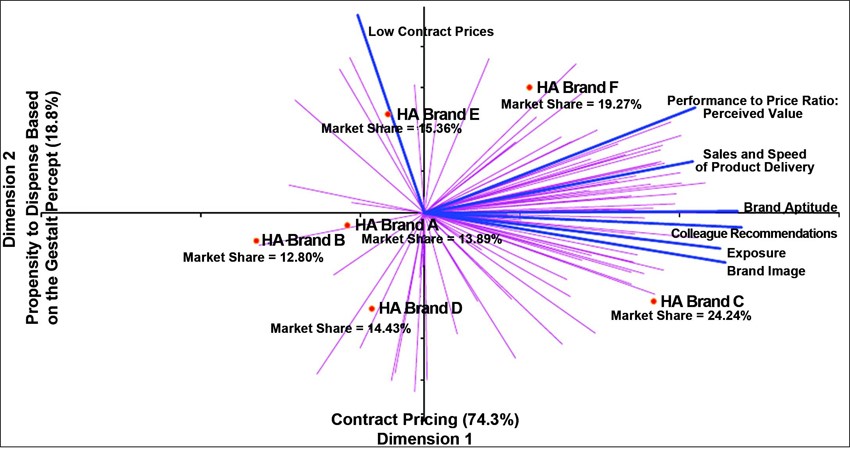
The trouble with correspondence analysis is not the process itself – it is the accompanying map that is created which attempts to show the brands and attributes. The maps below represent some of the clearer examples of what is created by a large number of practitioners – cluttered and chaotic correspondence maps where any useful insight is lost within the detail (can’t see the wood for the trees). Consider this, – in 99% of cases the audience is non-technical and will want to answer the questions above. It is easy to see how such maps can create confusion and misinterpretation.
Traditional brand perception maps are confusing
Introducing the Radial Landscape Map
The standard correspondence map has required an overhaul to bring about simplicity without reneging on statistical detail.
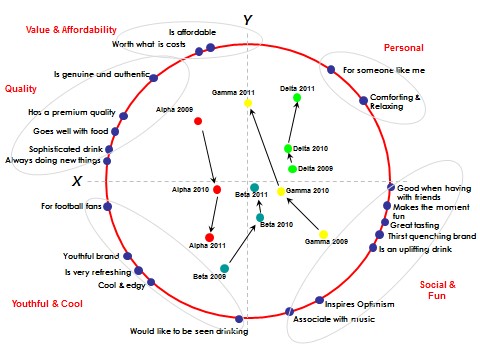
The Radial Landscape Map provides both visual clarity and analytical rigor in displaying brand attributes and corresponding brands. Using a proprietary adaptation of multivariate correspondence analysis we are able to map out the brand attributes and more importantly the latent constructs/themes that present themselves. The chart below is one recent example (the brands have been masked for confidential reasons)
What is the Radial Landscape Map showing?
Much like the previously cluttered version of the map above, we still have the X,Y dimensions that allow for the correct positioning of brands and image attributes.
The map above shows a battery of brand image attributes for a global soft drinks manufacturer and its’ localised competitors. The attributes are positioned along the perimeter of the map (dark blue dots) – some are clustered together depending on the correlation (relationship) between them (these are seen as synonymous in the minds of the consumer). With the right sample size, we see clustered themes falling out which is indicative of the latent constructs within the data…these are the natural underlying themes or categories you would expect the attributes to fall into.
The brands are placed inside the Radial Landscape Map. Those placed close to the centre of the map have an almost equal association with each of the brand image attributes. So, for instance we can see brand Beta move from a relatively strong association with ‘would like to be seen drinking’ in 2009 towards the centre of the map in 2011, indicating it may be losing its’ coolness in the eyes of consumers. On the contrary, brand Alpha has gradually moved away from value and authenticity and towards coolness and youthfulness. In this way, the maps are able to illustrate the shifts in customer perceptions over time, which of course has direct implications for pricing, marketing communications and even product design and development. Whether a brand has lost its’ core differentiators is clear from the radial landscape map.
Pushing the boundaries further…social media
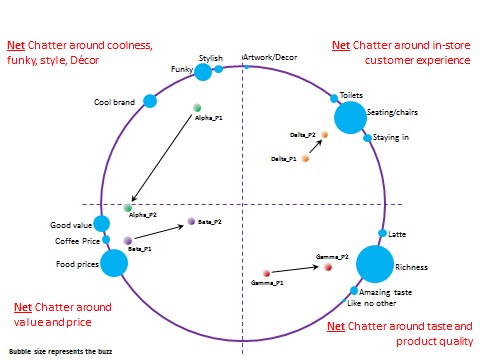
This epitomises our ability to capture big data on a small map. By analysing coded social media data, we have produced a map that illustrates the nature of social chatter (sentiment and tonality) associated with brands. Again, the brand names have been masked for client confidentiality)
For brand Delta on the map below, the social media chatter has been based around the ‘in-store customer experience’. Within this, the issue of ‘customer seating’ has been the central talking point in both periods of review. On the other hand, conversations for brand Gamma have related to product taste and quality.
Final thoughts
Modern brands operating in tough economic times are increasingly feeling cramped in the market place. The threat of new entrants and substitute products can easily shift customer perceptions and change market dynamics. The Radial Landscape Map provides clarity, insight and a window into the market place. It represents the competitive landscape and serves as a tool for marketing communications teams and brand managers to ensure; brand alignment with key differentiators, marketing messages resonate with the target audience and customers develop an affinity with the brand and its’ personality.
Ends –


