 Our Thinking
Are you getting the most from your marketing budgets?
For marketers, budgeting can often be a time of great tension. Marketers discuss and submit marketing spending plans to CFOs. Contained in these budgets might be some pet-projects of the CEO and perhaps some new marketing initiatives. Other elements are recurrent spending plans across the media and marketing mix. The tension in this exercise often comes via the CFO and finance department, which treat each line-item as an ‘unproven expense’. Finance colleagues demand more fact-based accountability, and increasingly these demands are being heard by CEOs.
According to a recent survey, the number one issue on chief marketers’ minds is ‘generating optimal results from their communications budget, alongside enhanced measurement to understand their returns on marketing investments’.
It is said that the effectiveness of marketing has reached an all-time low, according to a survey of 3,000 global marketers conducted by The Fournaise Marketing Group. The marketers surveyed reported that 65% of their marketing spend had no discernible effect on consumers. The report suggested the main cause of the waste can be largely attributed to lack of measurement.
One of the tried and tested approaches for marketing measurement is ‘marketing mix modeling’ (MMM) which links all of a firm’s marketing efforts, including digital media (pay per click, display banners), and offline media (TV, Press, Radio & Outdoor) to sales over time.
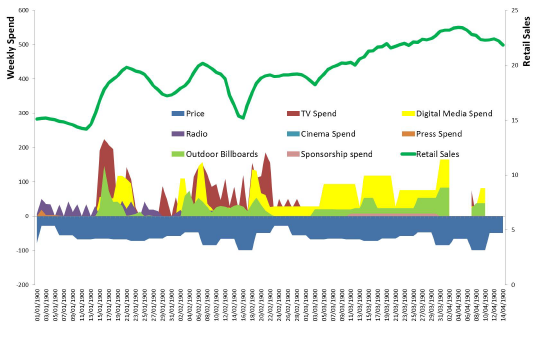
This is done through the development of an econometric model, of a firm’s sales over time. The model replicates the periodic patterns, peaks and troughs in company sales data. The chart below shows monthly retail sales for a household brand against the mix of media spending. Using this data it is possible to determine; which media initiatives are responsible for driving those “sales peaks”. From this the individual contributions of each marketing element can be determined and monetised.
Data: Historic marketing spend against sales
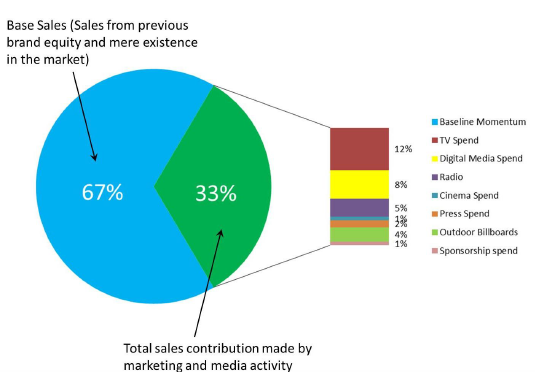
Developing a predictive model can help identify and quantify what marketing activities are contributing to a company’s lift in sales. Following this we can ‘decompose’ company sales or revenue and identify the specific contributions of each marketing program. In this way, we can determine how much ‘incremental revenue’ is generated from a marketing budget over a period of time, as shown below. From our example below, we can see that 67% of sales are being generated by what is known as “base momentum”, which is the level of sales you can expect without any marketing. This is treated as an accumulation of previous brand equity, goodwill and the distribution network. 33% of sales are being attributed to the entire marketing and media effort – of this TV is generating 12%, digital 8% and so on.
Decomposition: identifying the revenue contribution made by each marketing channel
By applying financial data to the decomposition we can determine the true return on investment (ROI) from each marketing and media campaign. From here a clear picture of which marketing activities are working and which are not thus emerges.
Apples with apples: Return on investment per £1 invested
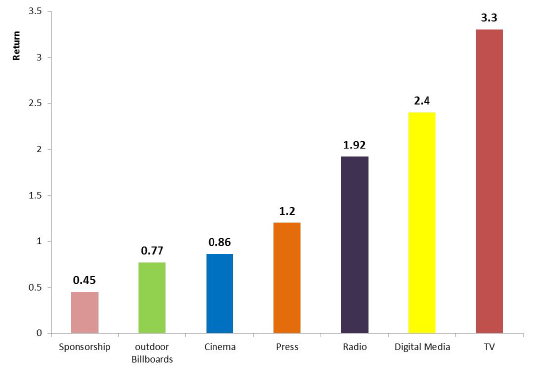
The modeling exercise determines what is and isn’t generating a return on investment. From the chart above we see how TV, digital media, radio and press each generate a positive return (i.e. for every £1 invested, they are generating more than £1). On the contrary, sponsorship, cinema and outdoor billboards are less efficient, loss making channels (i.e. for every £1 invested in outdoor billboards the return has been 77p – loss of 23p)
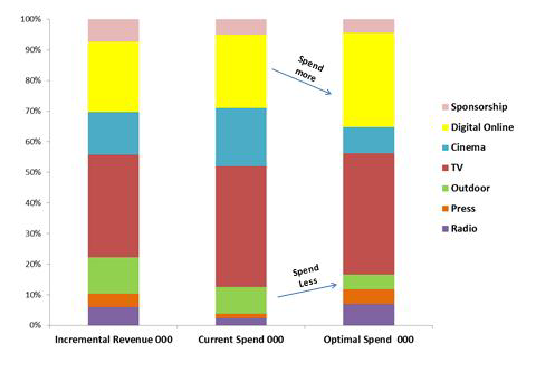
Modeling can also provide answers to other tough business questions, such as the effect on sales from seasonal and holiday periods, price promotions and coupon activity, price, distribution and social media engagement amongst others (we will explore these in future articles). Nevertheless, the most important stage of the entire exercise is to leverage the modelling insights in order to best allocate the marketing budget across the next budget cycle. This requires an optimization exercise, which, based on model results, reallocates the same budget across the same channels whilst attempting to maximise sales. The optimisation process is typically done with fixed or last years’ spend; so is designed to show how much more revenue can be generated with the same spend.
There are different benchmarks depending on industry sector, but our experience at Bottom Line Analytics has shown this optimization of marketing spend tends to produce between 3 and 8 per cent higher total revenue growth from the same spend as in the previous budget cycle. Typically, we display this as shown below which compares the current budget with an ‘optimized budget’. The optimisation helps us to reallocate marketing investments and uplift sales.
Spend Optimisation: increase revenue with the same budget
The bottom-line for chief marketers is they no longer need to fly blind when it comes to setting and defending marketing. Furthermore, the adversarial tensions with finance do not have to be a part of the process. Marketing-mix modeling is a tool that marketers should use to understand how well their marketing spend is working. This is more so now than ever – the fragmentation of digital channels to market makes it ever more important to assess return on investment in a holistic manner. Couple this with the increasing external costs and competitive pressures on businesses and suddenly marketing measurement has become an imperative. Media mix modelling offers a statistically robust method of measuring marketing effectiveness.
Ends –