Skip to content
Market Mix Modeling │ Bottom-Line Analytics
  • Our Solutions
    • BLA Team
  • Our Experience
  • Services
    • Media Mix Modeling
    • Customer & Market Segmentation
    • Demand Forecasting
    • Social Media ROI Measurement
    • Brand Analytics: Radial Landscape Maps
    • CART – Predictive Analytics
    • Structural Equation Modeling
    • Key Drivers Analysis
    • Price Optimisation
  • Our Thinking
  • Testimonials
  • Contact Us
Site Search
Marketing Mix Modeling │ Bottom-Line Analytics Our Thinking

FREE WEBINAR: Monetising the Customer Experience

  • June 29, 2016July 26, 2016
  • by admin

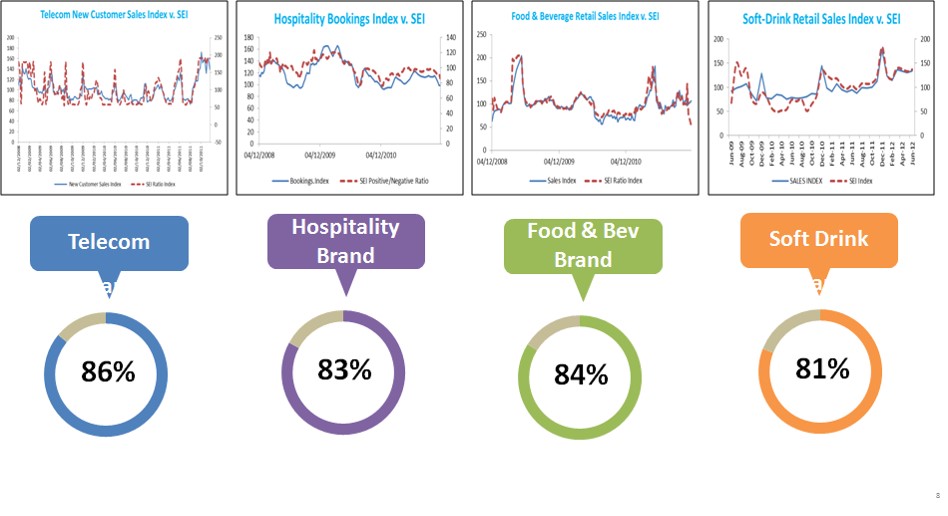
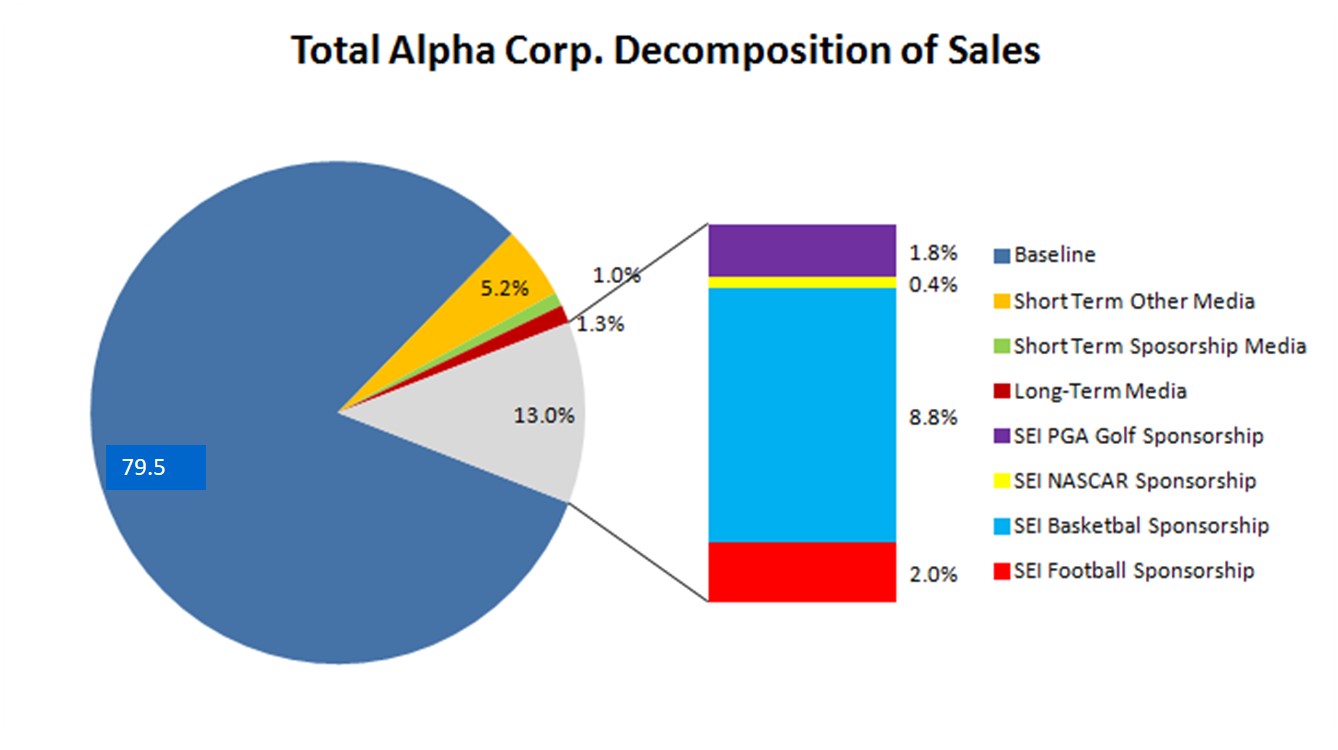
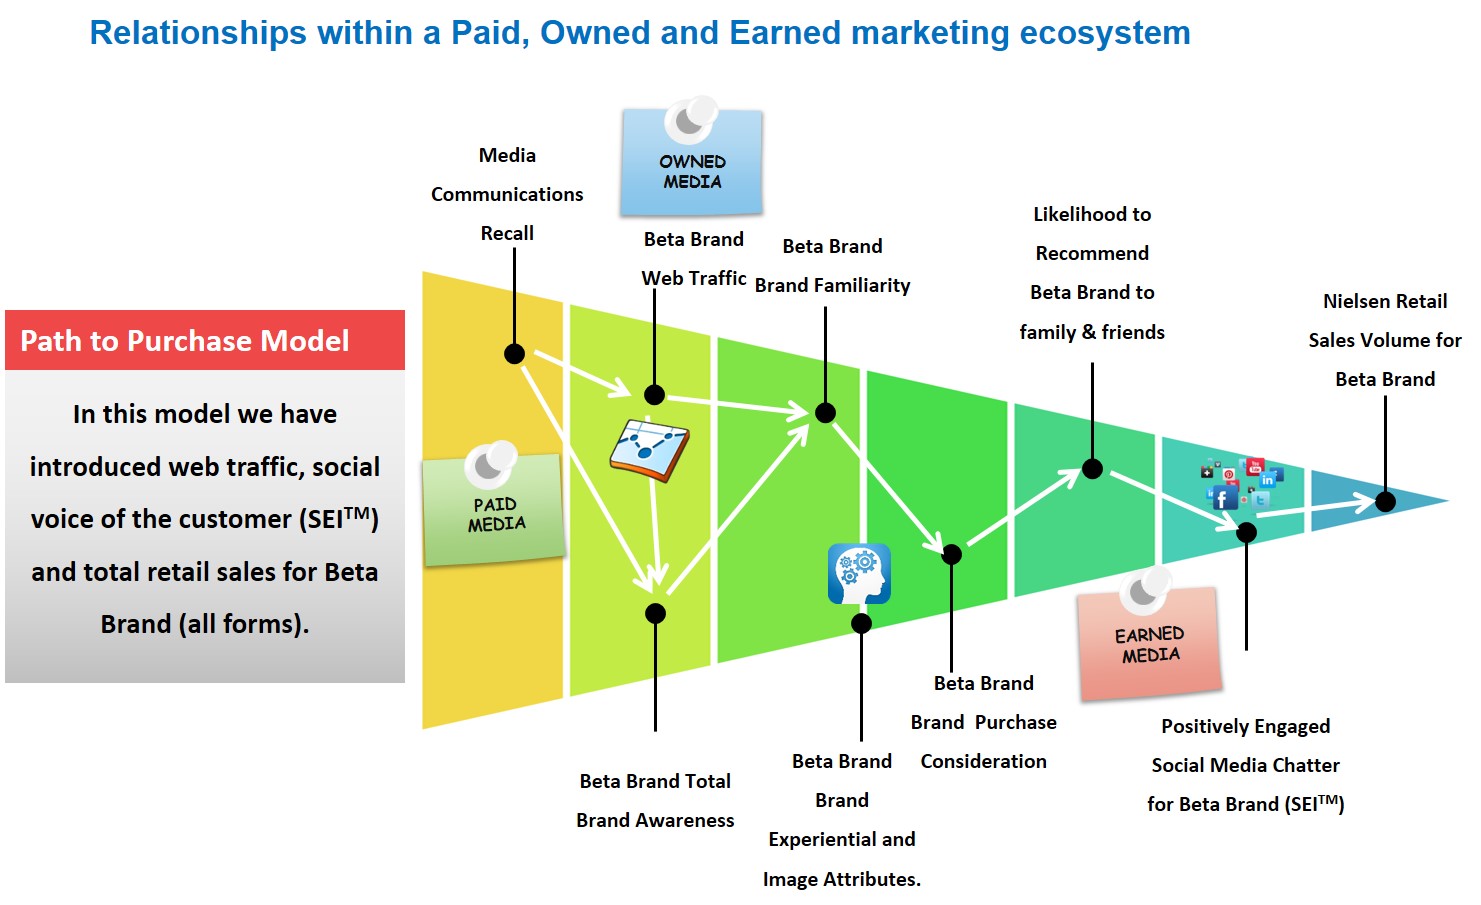
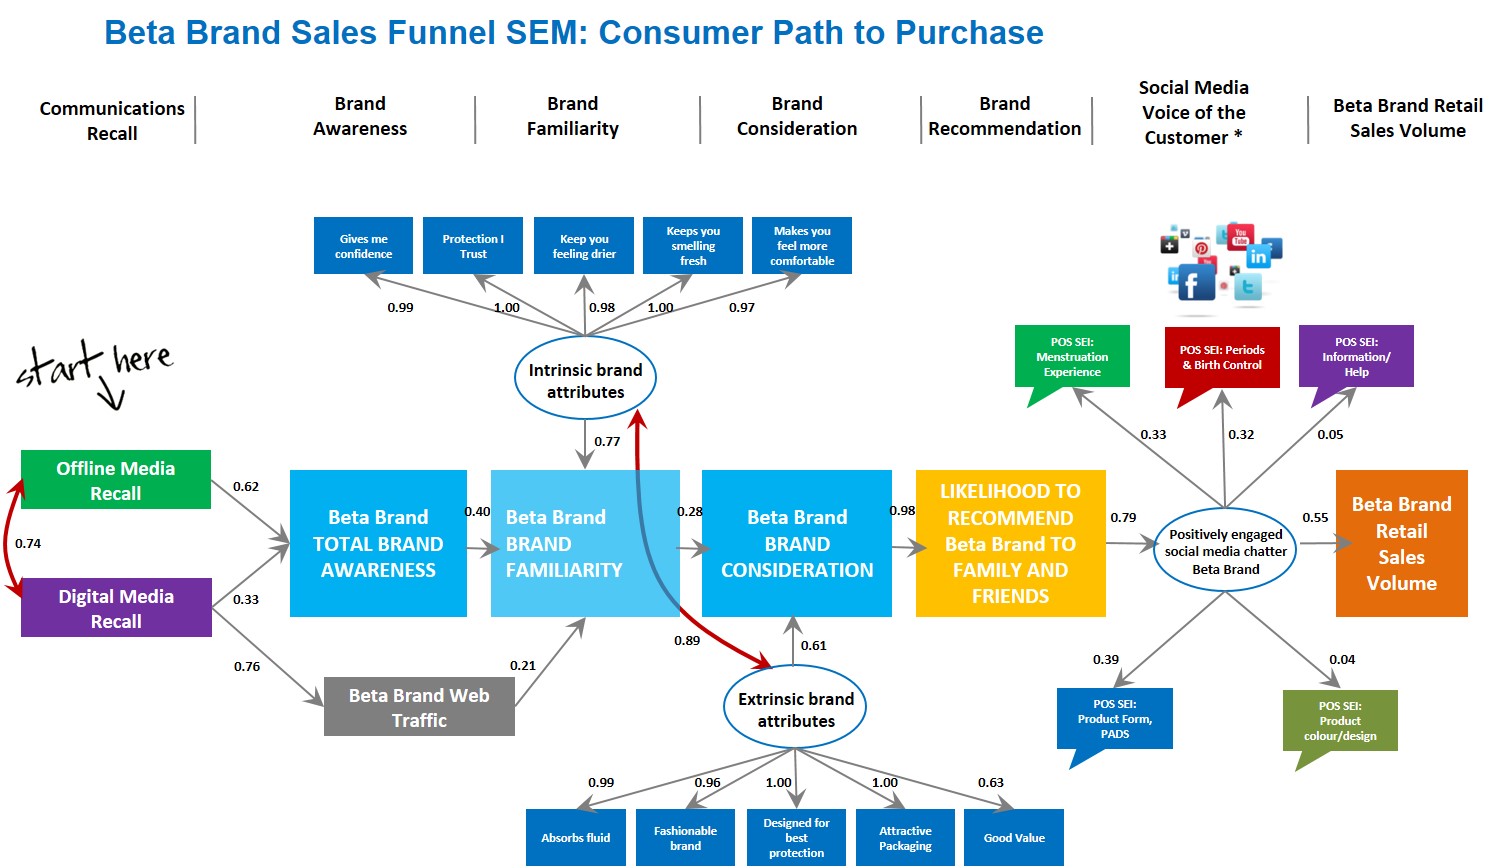
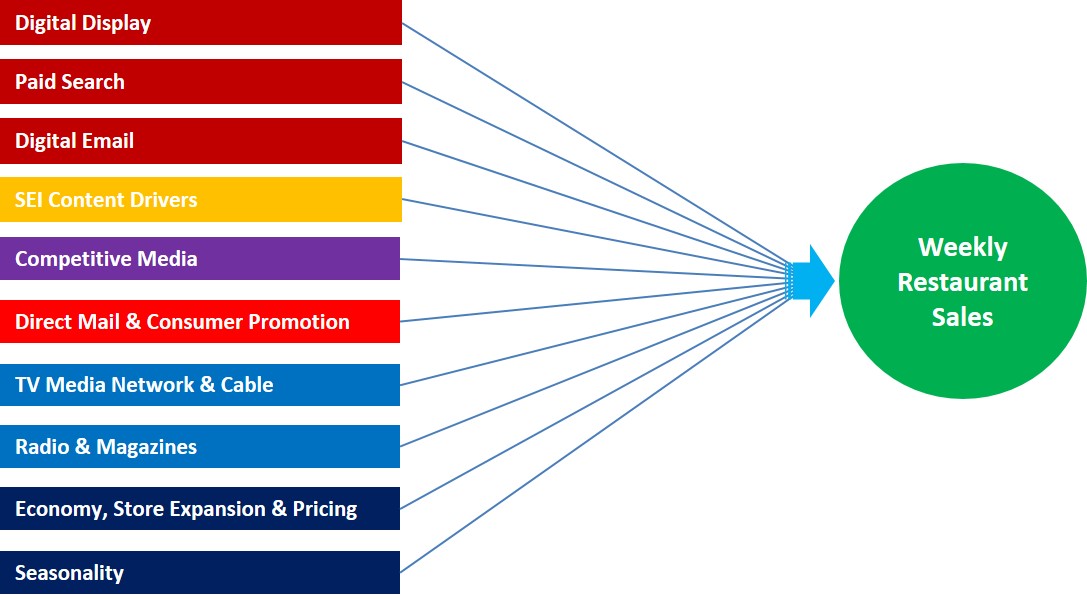
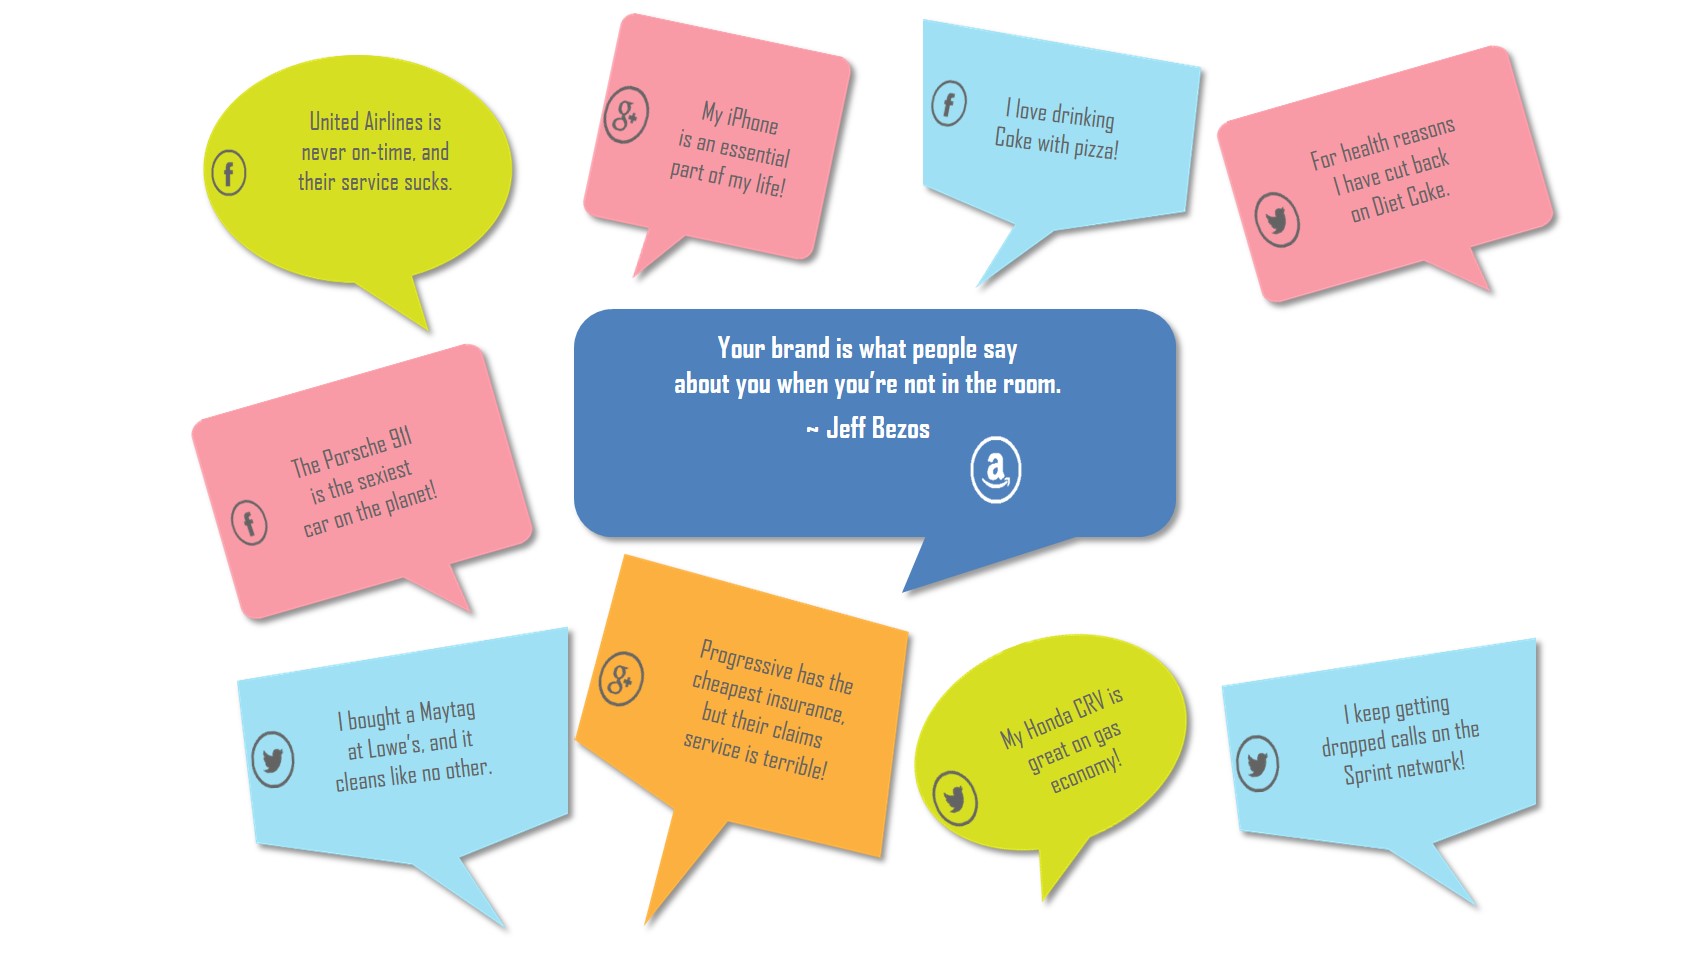
Social media is a rich source of commentaries on the Customer Experience. If this data could be turned into a relevant metric, with all its rich content, it could revolutionize brand insights and bring them to a stronger and more informed connection with customers.   BLA has developed an approach which converts text into a powerful metric that when packaged inside a media effectiveness model allows us to determine it’s impact on hard sales.


Customer Exp_2nd Augnew


Our Thinking

Our Recent Webinar on Measuring Sports Sponsorship ROI

  • June 24, 2016July 26, 2016
  • by admin

Here is a link to the recorded webinar

Marketing Mix Modeling │ Bottom-Line Analytics Our Thinking

Hillary & Bernie: Social Analytics for US Political Campaigns

  • March 1, 2016March 1, 2016
  • by admin

Applying innovative social media analytics to political campaigns is an interesting endeavor because it applies the actual words of voters towards understanding political views, engagement and intentions.  The purpose of this paper is to illustrate the value of what can be done and not to make any political pronouncements or specific conclusions.  

In this paper, we will be applying a unique approach to social media analytics and focusing on the Democratic campaigns of Hillary Clinton and Bernie Sanders. Our first step, here, involves mining hundreds of thousands of social media conversations about these respective campaigns, beginning in mid 2015.

Our approach is unique in that it scores textual conversations using “linguistic rules and language structure”.   This approach divides these comments into many exclusive themes and scores or translates textual conversations on these political candidacies into a metric called the Semantic Engagement Index or SEITM.  The fundamental thesis of this approach goes beyond word counting found in many social analytics approaches.   Here the major thesis presumes that it is not just words that matter but how those words are communicated and the specific context of the conversation.

The approach we have shown here has a special means of not just measuring the volume of comments but also the level of emotion linked to each candidate and the level of expressed or inferred commitment.  Based on the higher levels of these latter two elements, Sanders overall SEITM rating crossed and exceeded Hillary’s in December 2015, as shown below.

SEITM Positive/Negative Scores

Picture2

When we decompose the scores across tonality or sentiment-types, we see that Hillary has significantly more negative engagement than Bernie.

Net SEITM Scores by Candidate

Picture3

Because our method can score the level of positive emotion and inferred commitment behind a candidate, we see an interesting contrast between Hillary and Bernie.   While Hillary still leads in the volume of comments, a much larger proportion of Bernie’s supporters show more positive emotion and commitment behind their candidate.

Picture4


Likewise, for each candidate, we can decompose their SEITM scores into specific content or reasons behind their supporter’s engagement towards their candidate.  As shown below, Hillary’s overall engagement is trended below and we see the negative driver of “truthfulness” driving much of her overall SEITM or engagement decline.

Picture5

A key question or issue with respect to the SEITM metric and approach shown here, is how well can it predict outcomes, below, we show how well the SEITM actually fits a historical composite of 12 different political polls.   The answer seems to be quite promising and perhaps we could say that while it might not be perfect, could it be any worse than current political polling in predicting outcomes?

If we look at Bernie’s data, we could also say that his momentum is such he could become the leader in voter preference sometime this summer.

Picture6

Social Analytics and Political Intelligence

Social media analytics, when applied correctly, can generate deep and valuable insights into various political candidates and campaigns.   In this focused example, we find that, while Hillary Clinton has an advantage in numbers (of comments), she shows vulnerabilities on several elements, including more overall negatives, less commitment and positive emotional connections.  Some of these negatives are being driven by some perceived issues with “truthfulness”.

Marketing Mix Modeling │ Bottom-Line Analytics Our Thinking

The Elusive Measurement Dilemma of Sports Sponsorship ROI

  • March 1, 2016March 1, 2016
  • by admin

For many companies, sponsorship marketing represents a major element or component of their marketing mix.  This could involve significant licensing fees to have one’s brand name attached to a stadium, or for the right to be designated the “official sponsor of……, in addition to branded advertising of events and sports tournaments.  Without a doubt, event and sports marketing is big business.  Global sponsorship spending is projected to grow nearly 5% in 2016 to $60.2 billion (Media Agency Daily, 1/14/16).

While such large investments would seem to demand high accountability and a formal and financial ROI assessment, this has generally not been the case.  In fact, the “gold standard” for “measuring incrementality” and ROI, marketing-mix models, have woefully fallen short in accurately and holistically measuring the return-on-investment to these activities.

Instead, marketers have more relied on indirect approaches to measuring sponsorship impact through various custom-survey and tracking metrics.  These metrics include measures of media exposure generated, social media comments, brand awareness, awareness of brand’s sponsorship, attitudes towards the brand, and lead generation.

A Solution to the Dilemma

Despite the high stakes and investment in sponsorship marketing, sponsors are often at a loss in coming up with a viable means for measuring the ROI of these investments.

A recent study by Performance Research/IEG  found that 40 percent of sponsors spend less than 1 percent of their sponsorship budgets on all of their sponsorship metrics, while more than a quarter of them spend nothing at all. This might well be a reflection of their frustration and disappointment in current measurement approaches. According to another recent study by the Association for National Advertisers (ANA) about 40% of sponsors are dissatisfied with their company’s ability to measure sponsorship and event ROI.

One of the key objectives of sponsorship marketing is to link brands to the passion and engagement that fans feel towards the sports, teams or events.   It has therefore been this emotional component that has made sponsorship ROI measurement so difficult & elusive.  This has often relegated sponsors to only measure aggregate awareness or recall.  Such measures are a far cry and fall very short of tangible and financially-based ROI metrics.

A former colleague from a prior job introduced me to a new concept that I believe brings great promise towards actual ROI measurement for sponsorships.  This approach actually uses social media as the raw material for building a more effective and predictive metric.   This approach converts textual reviews (from social media or other similar textual sources) into a metric called the Semantic Engagement Index or SEITM.

What is different about this approach is that it uses a linguistics-based method for “scoring textual data”.   The approach is based on the idea that it is not just words that matter, but also how customers write about brands and sports events.  In other words, context is important; and the scoring algorithm recognizes and accounts for different levels of emotion (for example, “like” has a lower rating than “love”).   Also, when personal pronouns are used or ownership is inferred (“My Coca-Cola” instead of “a Coca-Cola”) there is a higher score conferred due to a higher level of expressed personal engagement.  By applying this to social media comments on the sport and brand, we should be able to arrive at a metric that scales customer engagement towards this sponsored sport or event.

Where we are leading this, here, is that we want to use the SEITM as an input into a marketing-mix model in order to get the full benefit and value measurement of sponsorship ROI.  This makes sense because this metric can capture the engagement fans and customers have towards a sport or event.   It also makes sense in that this SEITM has proven to link to and be highly correlated to brand sales across a number of different businesses, as shown below.

CorrelCase Study

The client where I first applied this sponsorship ROI method was a major B-to-B services organization.  Their marketing was unique in that 60% of every marketing dollar spent went towards 4 sports sponsorships, including (1) PGA Golf, (2) NASCAR, (3) NFL Football & (4) NCAA March Madness Basketball. We will call this company Alpha Corporation.

Alpha’s major objective was to come up with a better approach to measuring their substantial marketing investment and the ROI of these individual sponsorships.  Facing a rather stagnant 2% year-over-year growth in their total business, Alpha was keenly interested in understanding how to better allocate their future marketing dollars towards their most productive sponsorships and marketing activities in order to recharge their business growth to a higher level of performance.

As shown below, our marketing mix model was able to demonstrate that these four sponsorship activities generated incremental sales equal to 13% of total revenu

Pie chart decompand 64% of their total marketing-driven sales.  Basketball and Football stood out with the largest impact.  Overall, their sponsorship investment actually generated a positive ROI.  This was in direct contrast to prior analytics and modeling efforts,  which indicated that the investment was a substantial money loser.  It is also interesting to note that the 13% overall sponsorship impact contrasted to just a 1% impact from all of Alpha’s sponsorship-tagged media.

The main impact of our modeling efforts, pointed towards a recommendation of how Alpha should invest its marketing funds going forward.   The chart below illustrates this.

Picture1Our task was to isolate the sponsorship events with the highest ROI and which were most effective in driving enterprise growth.   As shown above NFL Football was most effective in driving growth; while NCAA Basketball generated the highest net returns.

In the following year, Alpha substantially expanded its NFL investment and maintained a high level of spend behind NCAA Basketball; while cutting back spending on NASCAR.   The good news is that growth accelerated from 2 to 6 percent the following year.

A New Approach to a Difficult Measurement Challenge?

After a number of years doing media mix models, and encountering a key short-coming of conventional approaches to measuring sponsorship ROI, I am very encouraged that a viable and effective solution appears to have been discovered.

Using the SEITM as a data input makes a lot of sense because it measures customer engagement both with the sport and sponsor brand.  This is close to uncovering and objectively measuring the “passion” that fans feel toward a sport or event.  Given the nature of what brands are trying to achieve with their sponsorship dollars,  (i.e. connect their brand to the passion that fans feel toward the sport or event), I am very encouraged that this could be the solution that closes the gap.

Michael Wolfe, mjw@bottomlineanalytics.com

Our Thinking

Customer Path-to-Purchase & Structural Equation Modeling (SEM)

  • February 3, 2016February 3, 2016
  • by admin

Funnel stages


Successful marketing is, by definition, always aiming at a”moving target”.  That is because every customer is on a journey that covers many brand-relevant “touch-points”; which enable these customers to gain awareness, familiarity and consideration; and eventually purchase and acquire direct brand experience, which hopefully will earn that customer’s loyalty.  Marketing, therefore, needs to provide the relevant stimulus at each stage of that journey in order to maximize the likelihood of consumer purchase and eventual loyalty conversion.

For the marketer, “mapping” this customer path-to-purchase journey is essential and critical for numerous reasons:

  1. For gaining deep insight into what customers are doing, how they are engaging your brand and the steps they follow towards purchase and beyond.
  2. It documents existing and relevant “touch points” and “gates” that customers need to take across different channels prior to purchase.
  3. It is a vital “blue-print” for the customer-brand experience.

In order to fully comprehend and understand this journey, quantification needs to occur.   This quantification requires a precise knowledge of the different stages of the journey, the customer flow and the impact of marketing stimuli affecting each stage.

One such tool is an analytic technique called “Structural Equation Modeling (SEM)”.  SEM is an advanced analytical technique that allows us to understand and quantify the causal & synergistic relationships across the path-to-purchase and different channels & customer “touch points”.  It is different from regression and other statistical methods because:

  1. It allows for multiple dependent and independent variables
  2. That it can be designed across pathways or customer touch points with separate equations.
  3. It is well suited towards hypothesis testing
  4. It accounts for variable inter-relationships or synergies
  5. It can handle multiple data types and sources
  6. It provides a means for the emergence of latent or unobserved constructs or processes.

The case-study we are focusing on here involves a personal care brand called “Beta”.  The traditional “purchase funnel” as shown below, is one of the well known path-to-purchase frameworks.   With various data from Brand Beta, we can then construct an SEM model to test this hypothesis and likewise quantify the relationships across that journey and through the various “touch points”.  Below illustrates this funnel and a hypothesis of where various media affect these stages.

SEM Customer Journey POE Design Funnel


The SEM we constructed here covers a multitude of different data forms and types:

  1. Traditional mass media activity
  2. Digital media activity
  3. Web traffic and online behavior
  4. Consumer survey tracking data on brand awareness, brand image and purchase consideration over time
  5. Social media metrics, using our proprietary Semantic Engagement Index or SEItm for Beta Brand over time
  6. Retail sales or purchase data for  Beta Brand over time
  7. Customer loyalty and/or “willingness-to-recommend” survey data.

SEM Customer Journey POE


The SEM model covers 7 distinct phases of the “path-to-purchase” customer journey, as shown on the upper column headings.  While the above diagram describes and quantifies relationships, the insight comes from “building a story” which describes this “path-to-purchase customer journey”.

The Path-to-Purchase Story

Starting at “Communications Recall” we see the specific impact of Offline Mass Media and Digital Media with respect to “Total Brand Awareness”.  The black arrows show the value or relative influence; while the curved red arrows show interactions or synergies between active drivers or variables.

Offline media is shown here to have the dominant impact.   As shown, we also learn that there is a measured interaction or synergies that make the total effect of media greater when Offline and Digital Media are synchronized together.

As we also see, Digital Media has an impact on Beta’s web traffic, which in   turn is affected by certain “intrinsic brand image attributes”, specifically related to how this personal care brand makes customers feel about the brand.  These are also essential in developing brand familiarity.

After familiarity comes the stage where customers bring the brand into their “consideration set”.  Here, the major causal drivers include “extrinsic” brand factors including physical product performance, visual attraction and perceived value.  Interestingly, value is actually the weaker influence at this stage.  Also, all intrinsic attitudes also have an indirect influence toward consideration.

The next stage of this journey is where the customer forms an opinion about Beta Brand with respect to whether they would recommend this product to themselves, family and friends.  Shortly thereafter, they begin to divulge their customer experience either informally, or as represented through brand experiential comments on social media.  Here, customers will describe the situation and context of their experience with the brand and also how positive or satisfied they were with these experiences.  As the model shows, this Social/SEI input occurs immediately before and/or is concurrent with the purchase occasion.


Path-to-Purchase Insights

Understanding and mapping the path-to-purchase is critical for marketers because such an exercise reveals the critical channels and touch-points that influence the consumer’s journey towards purchase.  Understanding where marketing affects these stages and by how much is essential for getting a handle on the effectiveness and impact of marketing programs.

Structural Equation Modeling (SEM) is a powerful analytic tool which quantifies the causal relationships driving this customer journey.   It provides marketers with an essential blue-print for not only understanding the correct path-to-purchase, but the specific impact that marketing has at each stage of the journey.   The results of this exercise enable marketers to accurately tell the story of how and why customers move down this path to purchase and chose their brand.


End.

Michael Wolfe


Our Thinking

Brand Content Drivers Modeling: Optimizing Content Marketing

  • February 1, 2016February 1, 2016
  • by admin

Content marketing is a strategic marketing approach focused on creating and distributing valuable, relevant, and consistent content to attract and retain a clearly-defined audience — and, ultimately, to drive profitable customer action. (contentmarketinginstitute.com)

In other words, content marketing is all about finding the right message to deliver to the right customer, at the right time, for purposes of driving profitable revenue for brands

In order to develop successful content for marketing, the precise nature of that content must be discovered.  There is no better place to find this content than from the actual words of consumers or customers about your brand.   Social media provides a rich source of these unobtrusive and totally honest comments for finding the most relevant content insights.

In this paper, we are going to review a case for a company we will call Alpha.  Alpha is a masked name and some of the data have been altered to preserve confidentiality.  Alpha is a Mexican restaurant that competes in a very crowded field of national and regional chains.

In order to determine the critical content Alpha needs to incorporate in its marketing communications, we embark on an exercise to build a special kind of media-mix model.   The architecture of this model is shown below and consists of all digital and traditional mass media, plus external factors, store penetration and pricing.

Design

In addition, we have included 6 content-theme drivers in the model.  These were derived from our proprietary method for converting text-based brand-experience comments from social media into a highly predictive metric we call the Semantic Engagement Index or SEITM.

Alpha is in a rather precarious situation.  Its retail sales are down -5.2% for the year.  The chain’s strategy has been focused on efficiency through its drive-up and online ordering system and to keep costs and prices low. Its’ product line and menu, however, have remained basically the same for the past 10 years.   Management has a sense that the company is losing its relevance with its customers, but are not clear on the specifics of why this is the case.  Alpha also competes in a category with a large array of national, regional and local units.  The company is seeking answers to understand what its strengths are and what particular areas they need to improve

Once we pull hundreds of thousands of these “customer-brand experience” comments, we use advanced analytics to segment them into critical content themes.  When we put these into a predictive model, we have essentially monetized how and in what way customers value a brand based on their actual words.  Doing so thus forms the essential raw material for effective content marketing.  These statements form the essence of what a brand means to its customers.

Word Clouds

After running and validating the predictive media-mix model, we are able to visually see the impact and relative importance of these customer-derived content drivers.   In the chart below, we see that the six content drivers for Alpha are Service, Delivery, Value, Food Quality, Convenience and the Menu.  Alpha’s strength lies in its ability to deliver value and convenience.  While these have been growing, however, declines in the remaining four drivers overwhelm the gains from value and convenience.  Overall, the SEITM  also shows a high statistical correlation to sales, making it an effective predictor.

River chart - Content Drivers

When decomposing the impact of the content-drivers, you will see the large and significant role it plays in driving sales or revenue, even when compared with all marketing combined.  This is because the SEItm content drivers really represent the complete “customer-brand experience” for Alpha.

Consistent with their strategy to drive efficiencies through low-cost fast and efficient drive-thru’s and online ordering, value and convenience drives more than 2/3rds of the 18% of revenue driven by these content drivers.

Decomp

Nevertheless, when we assess the year-over-year impact on Alpha’s growth, a more alarming story emerges. While gaining just 1.1% in sales from its core strengths, convenience and value, there is a -6.3% annual growth impact due to the declines from delivery, service, food quality and the menu.  Directionally, Alpha needs to embark on a transformational change in both its operations and the content of its marketing messages.

Due To Variance

While value and convenience seem like viable platforms to build its position in the market, these do not necessarily represent the values which will attract and retain new customers.

On the chart below, we see how Alpha compares to competitors with regards to how customers words define each brand.  Alpha shows its strongest proximity to convenience and also toward value.  Chains 3 and 4, but contrast are more positioned towards food quality and secondarily closer to service & delivery.  While Alpha experienced a -5.3% sales decline over the year, both Chains 3 and 4 experienced high single-digit growth.   A closer proximity towards service, delivery and food quality apparently forms the equation for growth in the Mexican segment.

Radial Map

For Alpha brand, analysis underscores that traditional strategies of focusing only on improving efficiencies in their drive-thru and online ordering was not sufficient to drive growth.   By ignoring menu diversity and improving food quality, they were driving customers to competition and generating a serious decline in sales.

The task ahead for Alpha is clear, if not daunting.  The company has to focus on improving its menu and the quality of its product and let the world know about it. This is both an operational and communicative transformation.  This will require broadening the content of its marketing messages to communicate to consumers the journey and destination that Alpha is pursuing to this end.

Going forward, Alpha needs to embark on a journey and, in process, direct the content of its marketing message to telling the world about this journey.  In so doing, Alpha will tell its customers that they are on a program for improving their menu and product quality.  This will make the company appear vulnerable but customers will understand if Alpha comes across as both serious & sincere, and most of all, delivers on its promises.  As shown, Content Marketing is all about marrying the right content with the media message.


End.

Michael Wolfe

Marketing Mix Modeling │ Bottom-Line Analytics Our Thinking

Measurement and the Magic of Message

  • November 9, 2015November 9, 2015
  • by admin


Somebody finally has to get out an ad, often after hours. Somebody has to stare at a blank piece of paper. Probably nothing was ever more bleak. This is probably the very height of lonesomeness. He is one person and he is alone – all by himself – alone. Out of the recesses of his mind must come words which interest, words which persuade, words which inspire, words which sell. Magic words.
Leo Burnett, founder, Leo Burnett Company

As the advertising pioneer Leo Burnett indicates, advertising is about the words, the creative, the fundamental message to the customer. These are the words that persuade the consumer to buy your brand. Measurement science or econometrics has mostly been about the media channel. Is TV more effective than radio? What kind of return did we get on our new digital ads?

What we propose here is that measuring advertising effectiveness should go beyond the channel and be more about measuring the message. To do this, understanding the relative impact and effectiveness of different media messages and creative is key. This idea gets much more to the heart of what advertising is all about. Herein lies at the center of how advertising effectiveness should be defined. This is indeed a disruptive idea that goes against how most effectiveness measurement and econometrics are being conducted today. This idea is what we call “message-mix” modeling.

Message Mix Modeling Defined

When we conduct Message-Mix Modeling, we collect data in a slightly different fashion than with traditional econometric models. Here we collect media GRPs or spending data “by the individual commercial execution” instead of by total channel. Here we will share a case study from a major wireless telecoms client.

With this information, we then go through an exercise to establish what we call the “marketing message architecture” for the wireless telecom brand case study we are going to show. Here we see the hierarchy of two major campaigns, one touting the brand’s claims for network quality and the other representing ads for wireless phone brands. Below the campaign level are specific messages and communication themes.

message arcitechture

For Network quality campaigns, the core messages cover specific claims on network coverage and network/data speed, which are two essential network performance attributes. Below the message level are the individual ads or executions which come under the message umbrella.

Insights

Instead of just looking at the impact of marketing by media channel, we are able to see the relative importance of core media campaigns and messages.

pie chart message mix decomp

Additionally, we are also able to gain the critical insight of how many messages should be aired into the market at one time in order to minimize the risk of “clutter” and too many messages. As shown on the chart to the right, there is significant diminishing and declining returns to media messages and it is critical that each brand manage these in order to avoid this pitfall.

message mix diminishing returns

As is the usual part of econometric models, our analysis focuses on ROI. With Message-Mix Modeling, however, this is ROI by message and creative execution. This gets to the heart of communication effectiveness by delivering insights into which specific communications work best.

ROI per pound spent

Finally, the step with the greatest value for Message-Mix Modeling is to use the model to actually optimize spending on a message basis. This outcome enables marketers and agency planners to focus on what message combinations are going to be most effective for the brand.

message mix opt

A Departure from Conventional Effectiveness Measurement

In this blog, we introduce you to “Message-Mix Modeling”. This is a departure from current marketing measurement conventions which focus only on media channels. The underlying value of this approach is based on its ability to focus on the core communication or messages of media. It gives us the tools for understanding effectiveness at this level and centers attention of marketing and agencies on what really matters, the creative and the communications.

Our Thinking

Radial Landscape Maps– A Revolution in Brand Mapping and…

  • November 9, 2015November 9, 2015
  • by admin

Image 1

Market researchers and data analysts have for many years used various visual representations of their data. Their objective has always been to ‘visualise the insight’ using a chart rather than to show rows and columns of tables.

One such chart that has been used over the years is the ‘brand perception map’.  The map is created via a multivariate statistical data reduction method known as ‘Correspondence Analysis’, which attempts to describe the relationship between a large battery of brand attributes and a number of brands*.  This has proven very useful within the market research community as often there has been a requirement to analyse competing brands against a set of descriptors that relate to, for example, individual personalities and perceptions held by customers.  In this way, correspondence analysis is an excellent technique used to tease out insights from survey data that would otherwise take hours, running and examining cross-tabulations.

Correspondence maps should help to answer the following questions:

ü  How is my brand viewed by the market?

ü  What are the perceptual attributes that distinguish the brands?

ü  Who are my close competitors viewed by the market?

ü  Which competitors do not really compete with my brand at all?

ü  What do the brand image attributes mean for communications strategy?

The trouble with correspondence analysis is not the process itself – it is the accompanying map that is created which attempts to show the brands and attributes. The maps below represent some of the clearer examples of what is created by a large number of practitioners – cluttered and chaotic correspondence maps where any useful insight is lost within the detail (can’t see the wood for the trees).  Consider this, – in 99% of cases the audience is non-technical and will want to answer the questions above.  It is easy to see how such maps can create confusion and misinterpretation.

Traditional brand perception maps are confusing

RM_Image 2 RM_Image 3

Introducing the Radial Landscape Map

The standard correspondence map has required an overhaul to bring about simplicity without reneging on statistical detail.

The Radial Landscape Map provides both visual clarity and analytical rigor in displaying brand attributes and corresponding brands.  Using a proprietary adaptation of multivariate correspondence analysis we are able to map out the brand attributes and more importantly the latent constructs/themes that present themselves.  The chart below is one recent example (the brands have been masked for confidential reasons)

RM_Image 4


What is the Radial Landscape Map showing?

Much like the previously cluttered version of the map above, we still have the X,Y dimensions that allow for the correct positioning of brands and image attributes.

The map above shows a battery of brand image attributes for a global soft drinks manufacturer and its’ localised competitors.  The attributes are positioned along the perimeter of the map (dark blue dots) – some are clustered together depending on the correlation (relationship) between them (these are seen as synonymous in the minds of the consumer).  With the right sample size, we see clustered themes falling out which is indicative of the latent constructs within the data…these are the natural underlying themes or categories you would expect the attributes to fall into.

The brands are placed inside the Radial Landscape Map.  Those placed close to the centre of the map have an almost equal association with each of the brand image attributes.  So, for instance we can see brand Beta move from a relatively strong association with ‘would like to be seen drinking’ in 2009 towards the centre of the map in 2011, indicating it may be losing its’ coolness in the eyes of consumers.  On the contrary, brand Alpha has gradually moved away from value and authenticity and towards coolness and youthfulness. In this way, the maps are able to illustrate the shifts in customer perceptions over time, which of course has direct implications for pricing, marketing communications and even product design and development.  Whether a brand has lost its’ core differentiators is clear from the radial landscape map.

Pushing the boundaries further…social media

This epitomises our ability to capture big data on a small map.  By analysing coded social media data, we have produced a map that illustrates the nature of social chatter (sentiment and tonality) associated with brands.  Again, the brand names have been masked for client confidentiality)

For brand Delta on the map below, the social media chatter has been based around the ‘in-store customer experience’.  Within this, the issue of ‘customer seating’ has been the central talking point in both periods of review.  On the other hand, conversations for brand Gamma have related to product taste and quality.

RM_Image 5


Final thoughts

Modern brands operating in tough economic times are increasingly feeling cramped in the market place.  The threat of new entrants and substitute products can easily shift customer perceptions and change market dynamics.  The Radial Landscape Map provides clarity, insight and a window into the market place. It represents the competitive landscape and serves as a tool for marketing communications teams and brand managers to ensure; brand alignment with key differentiators, marketing messages resonate with the target audience and customers develop an affinity with the brand and its’ personality.

Ends –

Marketing Mix Modeling │ Bottom-Line Analytics Our Thinking

Are you getting the most from your marketing budgets?

  • November 9, 2015November 9, 2015
  • by admin

For marketers, budgeting can often be a time of great tension.  Marketers discuss and submit marketing spending plans to CFOs.  Contained in these budgets might be some pet-projects of the CEO and perhaps some new marketing initiatives.   Other elements are recurrent spending plans across the media and marketing mix.    The tension in this exercise often comes via the CFO and finance department, which treat each line-item as an ‘unproven expense’.  Finance colleagues demand more fact-based accountability, and increasingly these demands are being heard by CEOs.

According to a recent survey, the number one issue on chief marketers’ minds is ‘generating optimal results from their communications budget, alongside enhanced measurement to understand their returns on marketing investments’.

It is said that the effectiveness of marketing has reached an all-time low, according to a survey of 3,000 global marketers conducted by The Fournaise Marketing Group. The marketers surveyed reported that 65% of their marketing spend had no discernible effect on consumers.  The report suggested the main cause of the waste can be largely attributed to lack of measurement.

One of the tried and tested approaches for marketing measurement is ‘marketing mix modeling’ (MMM) which links all of a firm’s marketing efforts, including digital media (pay per click, display banners), and offline media (TV, Press, Radio & Outdoor) to sales over time.

This is done through the development of an econometric model, of a firm’s sales over time.  The model replicates the periodic patterns, peaks and troughs in company sales data.  The chart below shows monthly retail sales for a household brand against the mix of media spending.  Using this data it is possible to determine; which media initiatives are responsible for driving those “sales peaks”.  From this the individual contributions of each marketing element can be determined and monetised.

Data: Historic marketing spend against sales

1 - Are you getting the most from your marketing budgets-01

Developing a predictive model can help identify and quantify what marketing activities are contributing to a company’s lift in sales.  Following this we can ‘decompose’ company sales or revenue and identify the specific contributions of each marketing program.  In this way, we can determine how much ‘incremental revenue’ is generated from a marketing budget over a period of time, as shown below.  From our example below, we can see that 67% of sales are being generated by what is known as “base momentum”, which is the level of sales you can expect without any marketing.  This is treated as an accumulation of previous brand equity, goodwill and the distribution network.  33% of sales are being attributed to the entire marketing and media effort – of this TV is generating 12%, digital 8% and so on.

Decomposition: identifying the revenue contribution made by each marketing channel

2 - Are you getting the most from your marketing budgets-01-01

By applying financial data to the decomposition we can determine the true return on investment (ROI) from each marketing and media campaign.   From here a clear picture of which marketing activities are working and which are not thus emerges.

Apples with apples: Return on investment per £1 invested

3 - Are you getting the most from your marketing budgets-01

The modeling exercise determines what is and isn’t generating a return on investment.  From the chart above we see how TV, digital media, radio and press each generate a positive return (i.e. for every £1 invested, they are generating more than £1).  On the contrary, sponsorship, cinema and outdoor billboards are less efficient, loss making channels (i.e. for every £1 invested in outdoor billboards the return has been 77p – loss of 23p)

Modeling can also provide answers to other tough business questions, such as the effect on sales from seasonal and holiday periods, price promotions and coupon activity, price, distribution and social media engagement amongst others (we will explore these in future articles).  Nevertheless, the most important stage of the entire exercise is to leverage the modelling insights in order to best allocate the marketing budget across the next budget cycle.    This requires an optimization exercise, which, based on model results, reallocates the same budget across the same channels whilst attempting to maximise sales.   The optimisation process is typically done with fixed or last years’ spend; so is designed to show how much more revenue can be generated with the same spend.

There are different benchmarks depending on industry sector, but our experience at Bottom Line Analytics has shown this optimization of marketing spend tends to produce between 3 and 8 per cent higher total revenue growth from the same spend as in the previous budget cycle.  Typically, we display this as shown below which compares the current budget with an ‘optimized budget’.  The optimisation helps us to reallocate marketing investments and uplift sales.

Spend Optimisation: increase revenue with the same budget

4 - Are you getting the most from your marketing budgets-01

The bottom-line for chief marketers is they no longer need to fly blind when it comes to setting and defending marketing.   Furthermore, the adversarial tensions with finance do not have to be a part of the process.   Marketing-mix modeling is a tool that marketers should use to understand how well their marketing spend is working.  This is more so now than ever – the fragmentation of digital channels to market makes it ever more important to assess return on investment in a holistic manner.   Couple this with the increasing external costs and competitive pressures on businesses and suddenly marketing measurement has become an imperative.  Media mix modelling offers a statistically robust method of measuring marketing effectiveness.

Ends –

Front Page

Welcome to Bottom Line Analytics

  • August 27, 2015November 9, 2015
  • by admin

Thank you for visiting our site.

We are a full service advanced analytics consultancy. We help drive higher brand performance by using data science and research insights.

Bottom Line Analytics is at the forefront of innovations in media effectiveness modelling (econometrics), brand positioning analysis and ‘Earned’ social media measurement and insights.

Our client experience extends across a broad range of sectors and geographic markets including Europe, Middle East, Asia and US.


Posts navigation

1 2

Meet our Market Mix Modeling and Analytics Team

Learn about the team
  • Our Solutions
    • BLA Team
  • Our Experience
  • Services
    • Media Mix Modeling
    • Customer & Market Segmentation
    • Demand Forecasting
    • Social Media ROI Measurement
    • Brand Analytics: Radial Landscape Maps
    • CART – Predictive Analytics
    • Structural Equation Modeling
    • Key Drivers Analysis
    • Price Optimisation
  • Our Thinking
  • Testimonials
  • Contact Us

What People Are Saying

...
- Leonard F. Murphy | Chief Editor & Principal Consultant
GreenBook Research Industry Trends
 
...
Marketing Director, major hotel chain.

Follow us on Social Media

Our European Affiliate

bottomlineanalytics.co.uk

Theme by Colorlib Powered by WordPress